


Monitoring Salmon and Steelhead Populations
As part of the license requirements for the Jackson Hydroelectric Project, Snohomish County PUD monitors salmon and steelhead (salmonid) populations in the Sultan River across multiple life stages. Each year, adult salmon and steelhead return from the ocean to spawn in the Sultan River, with salmon returning in the fall and steelhead returning in the winter. During spawning, the female deposits her eggs into a nest created in the gravel, called a redd. Redds protect the eggs as they develop into fry. As the fry emerge from the gravel, they begin their downstream journey to the estuary and eventually the ocean.
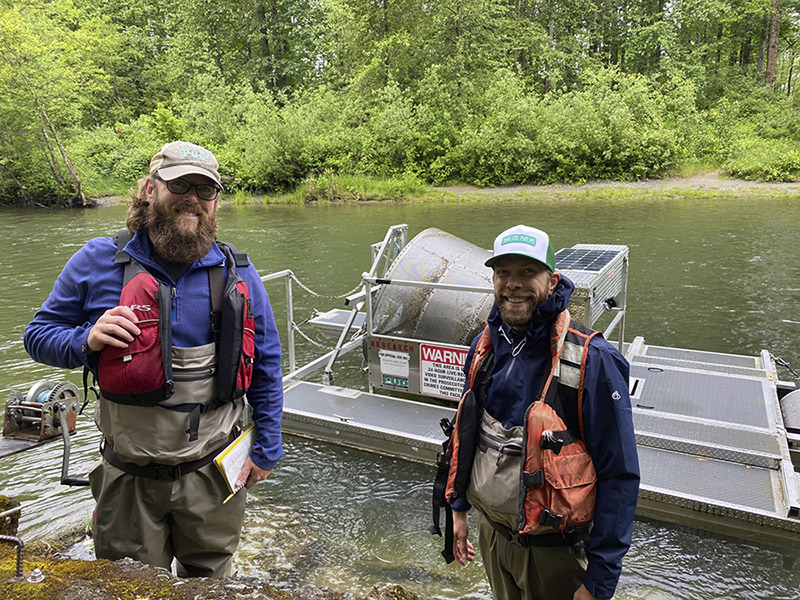
Adult salmonid monitoring (redd surveys)
One way the PUD monitors adult salmonid populations is through annual spawning ground (redd) surveys. During the spawning season, biologists walk or raft designated reaches of the Sultan River and count redds. These redd counts are used to estimate adult escapement, which is the number of fish that successfully return to the river to spawn. Escapement estimates provide an index of adult population trends over time and help evaluate how local conditions in the Sultan River relate to broader watershed patterns.
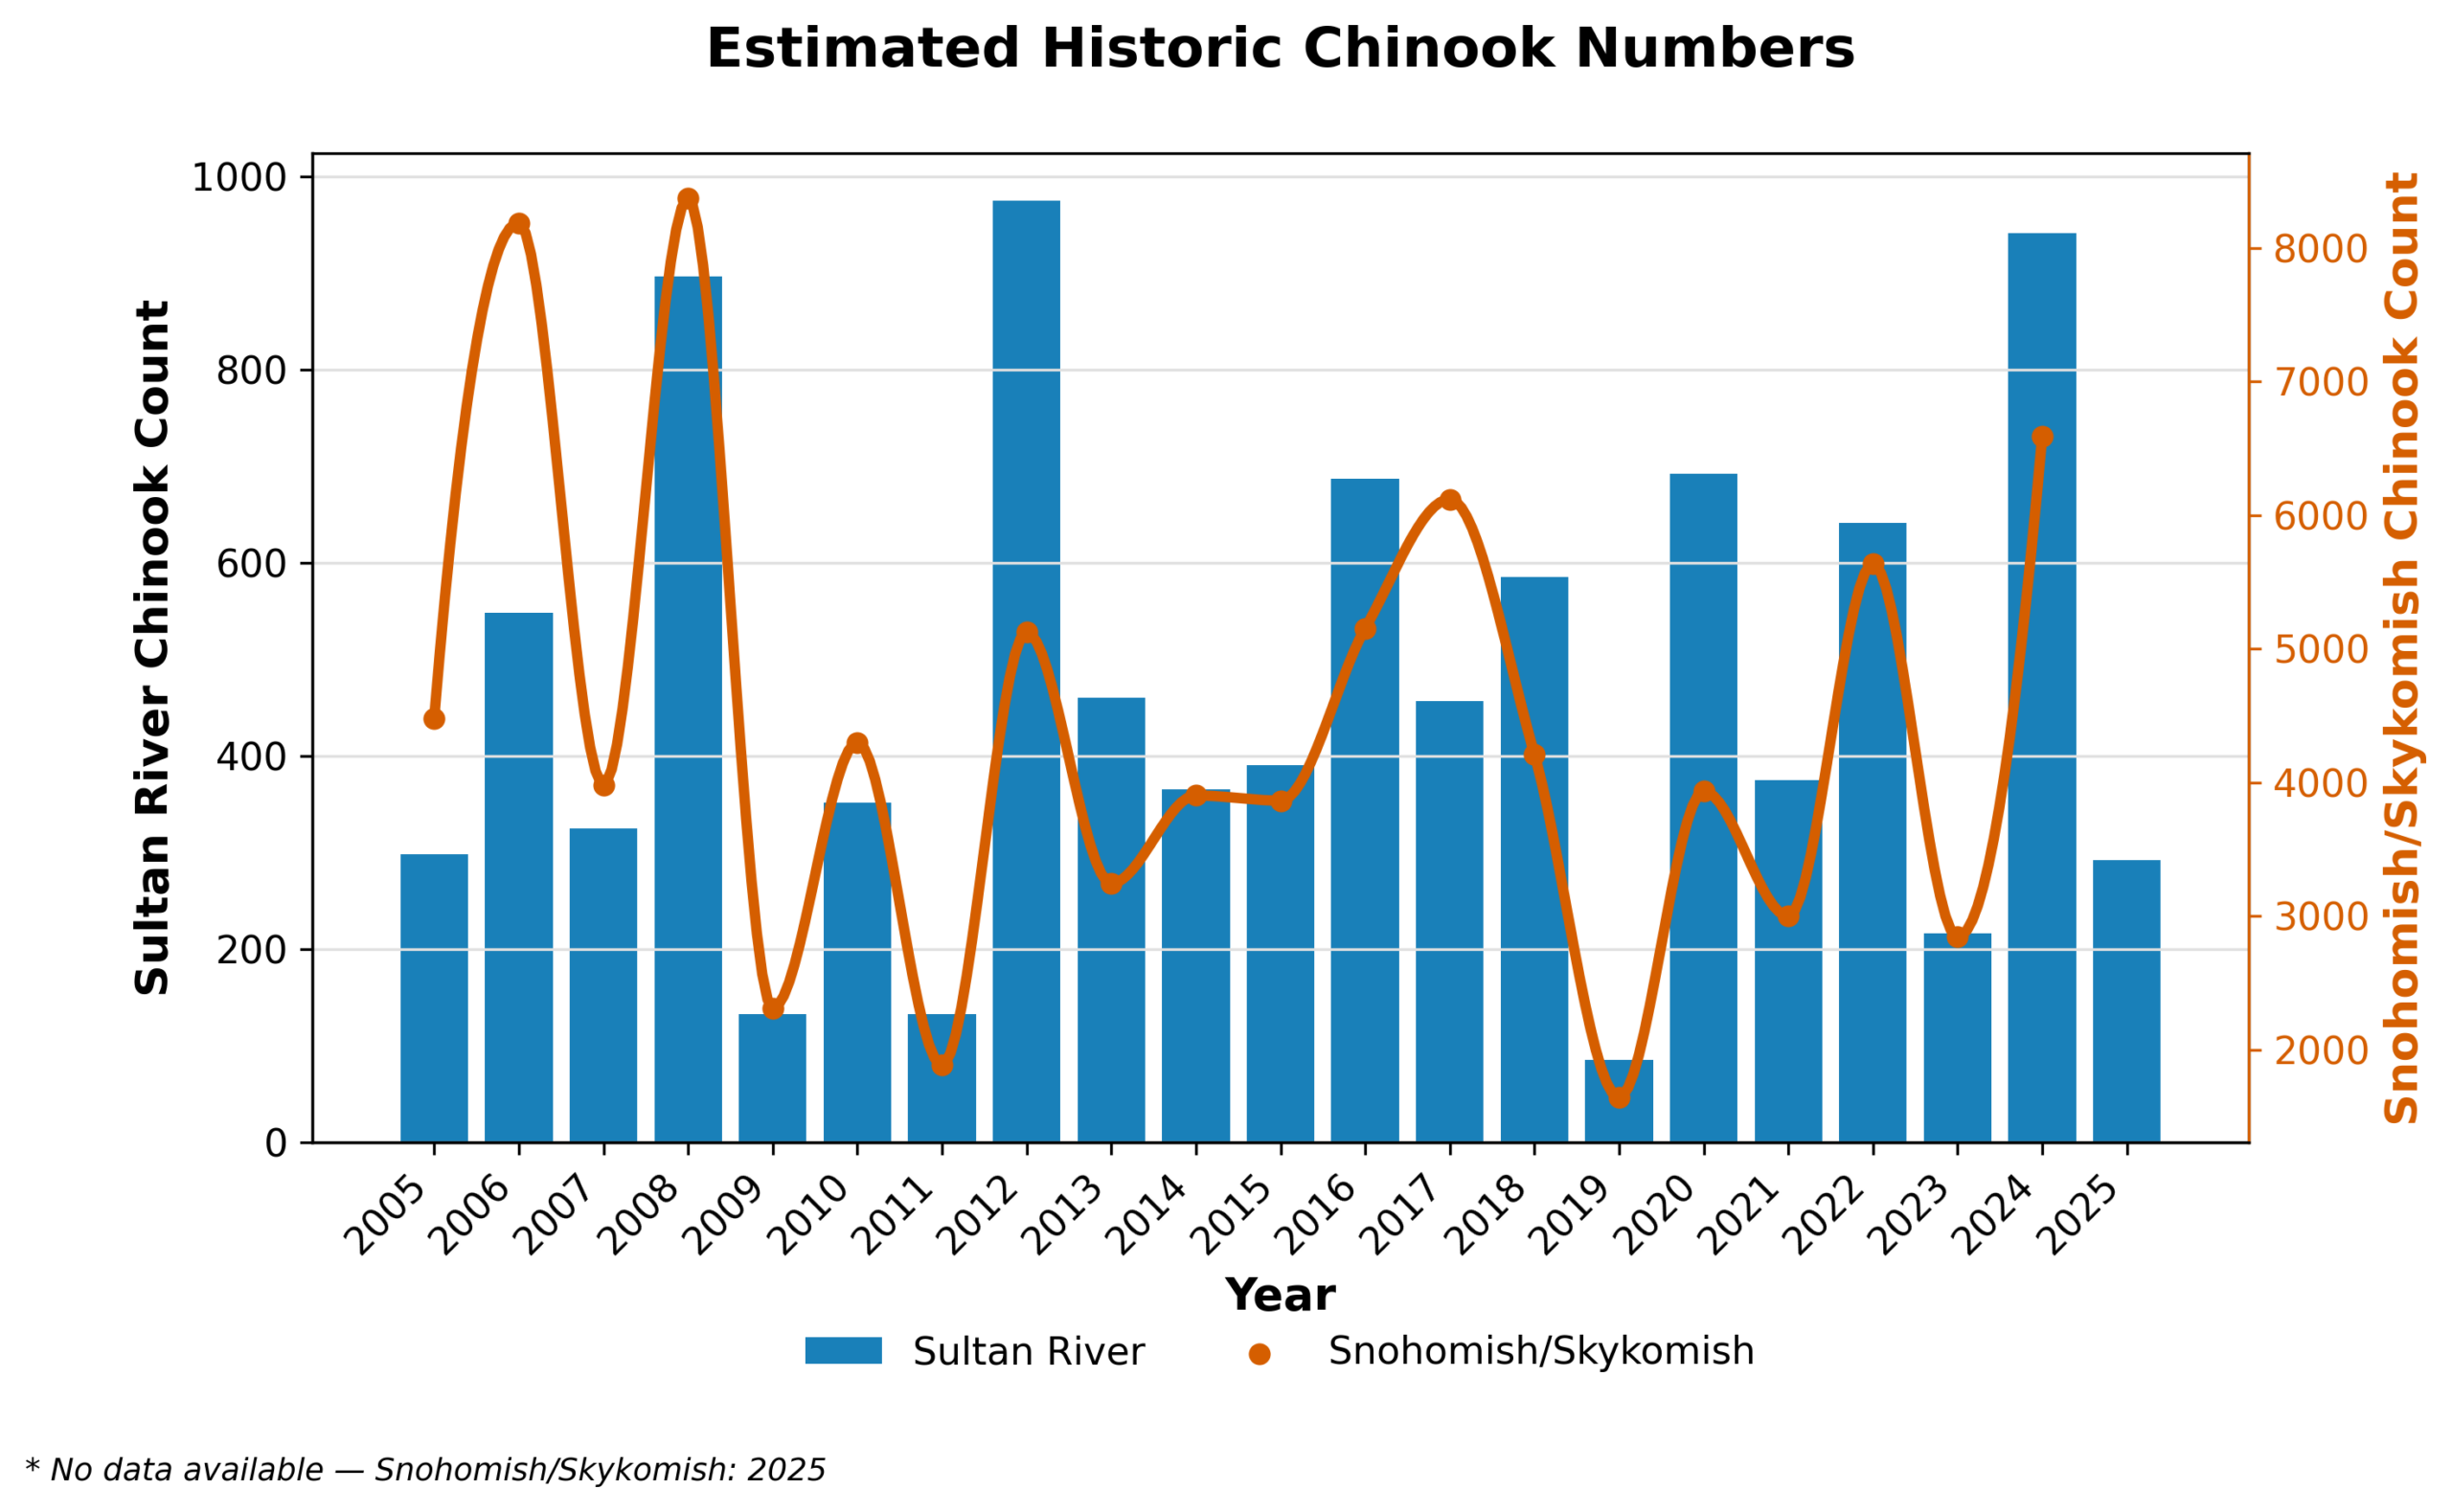
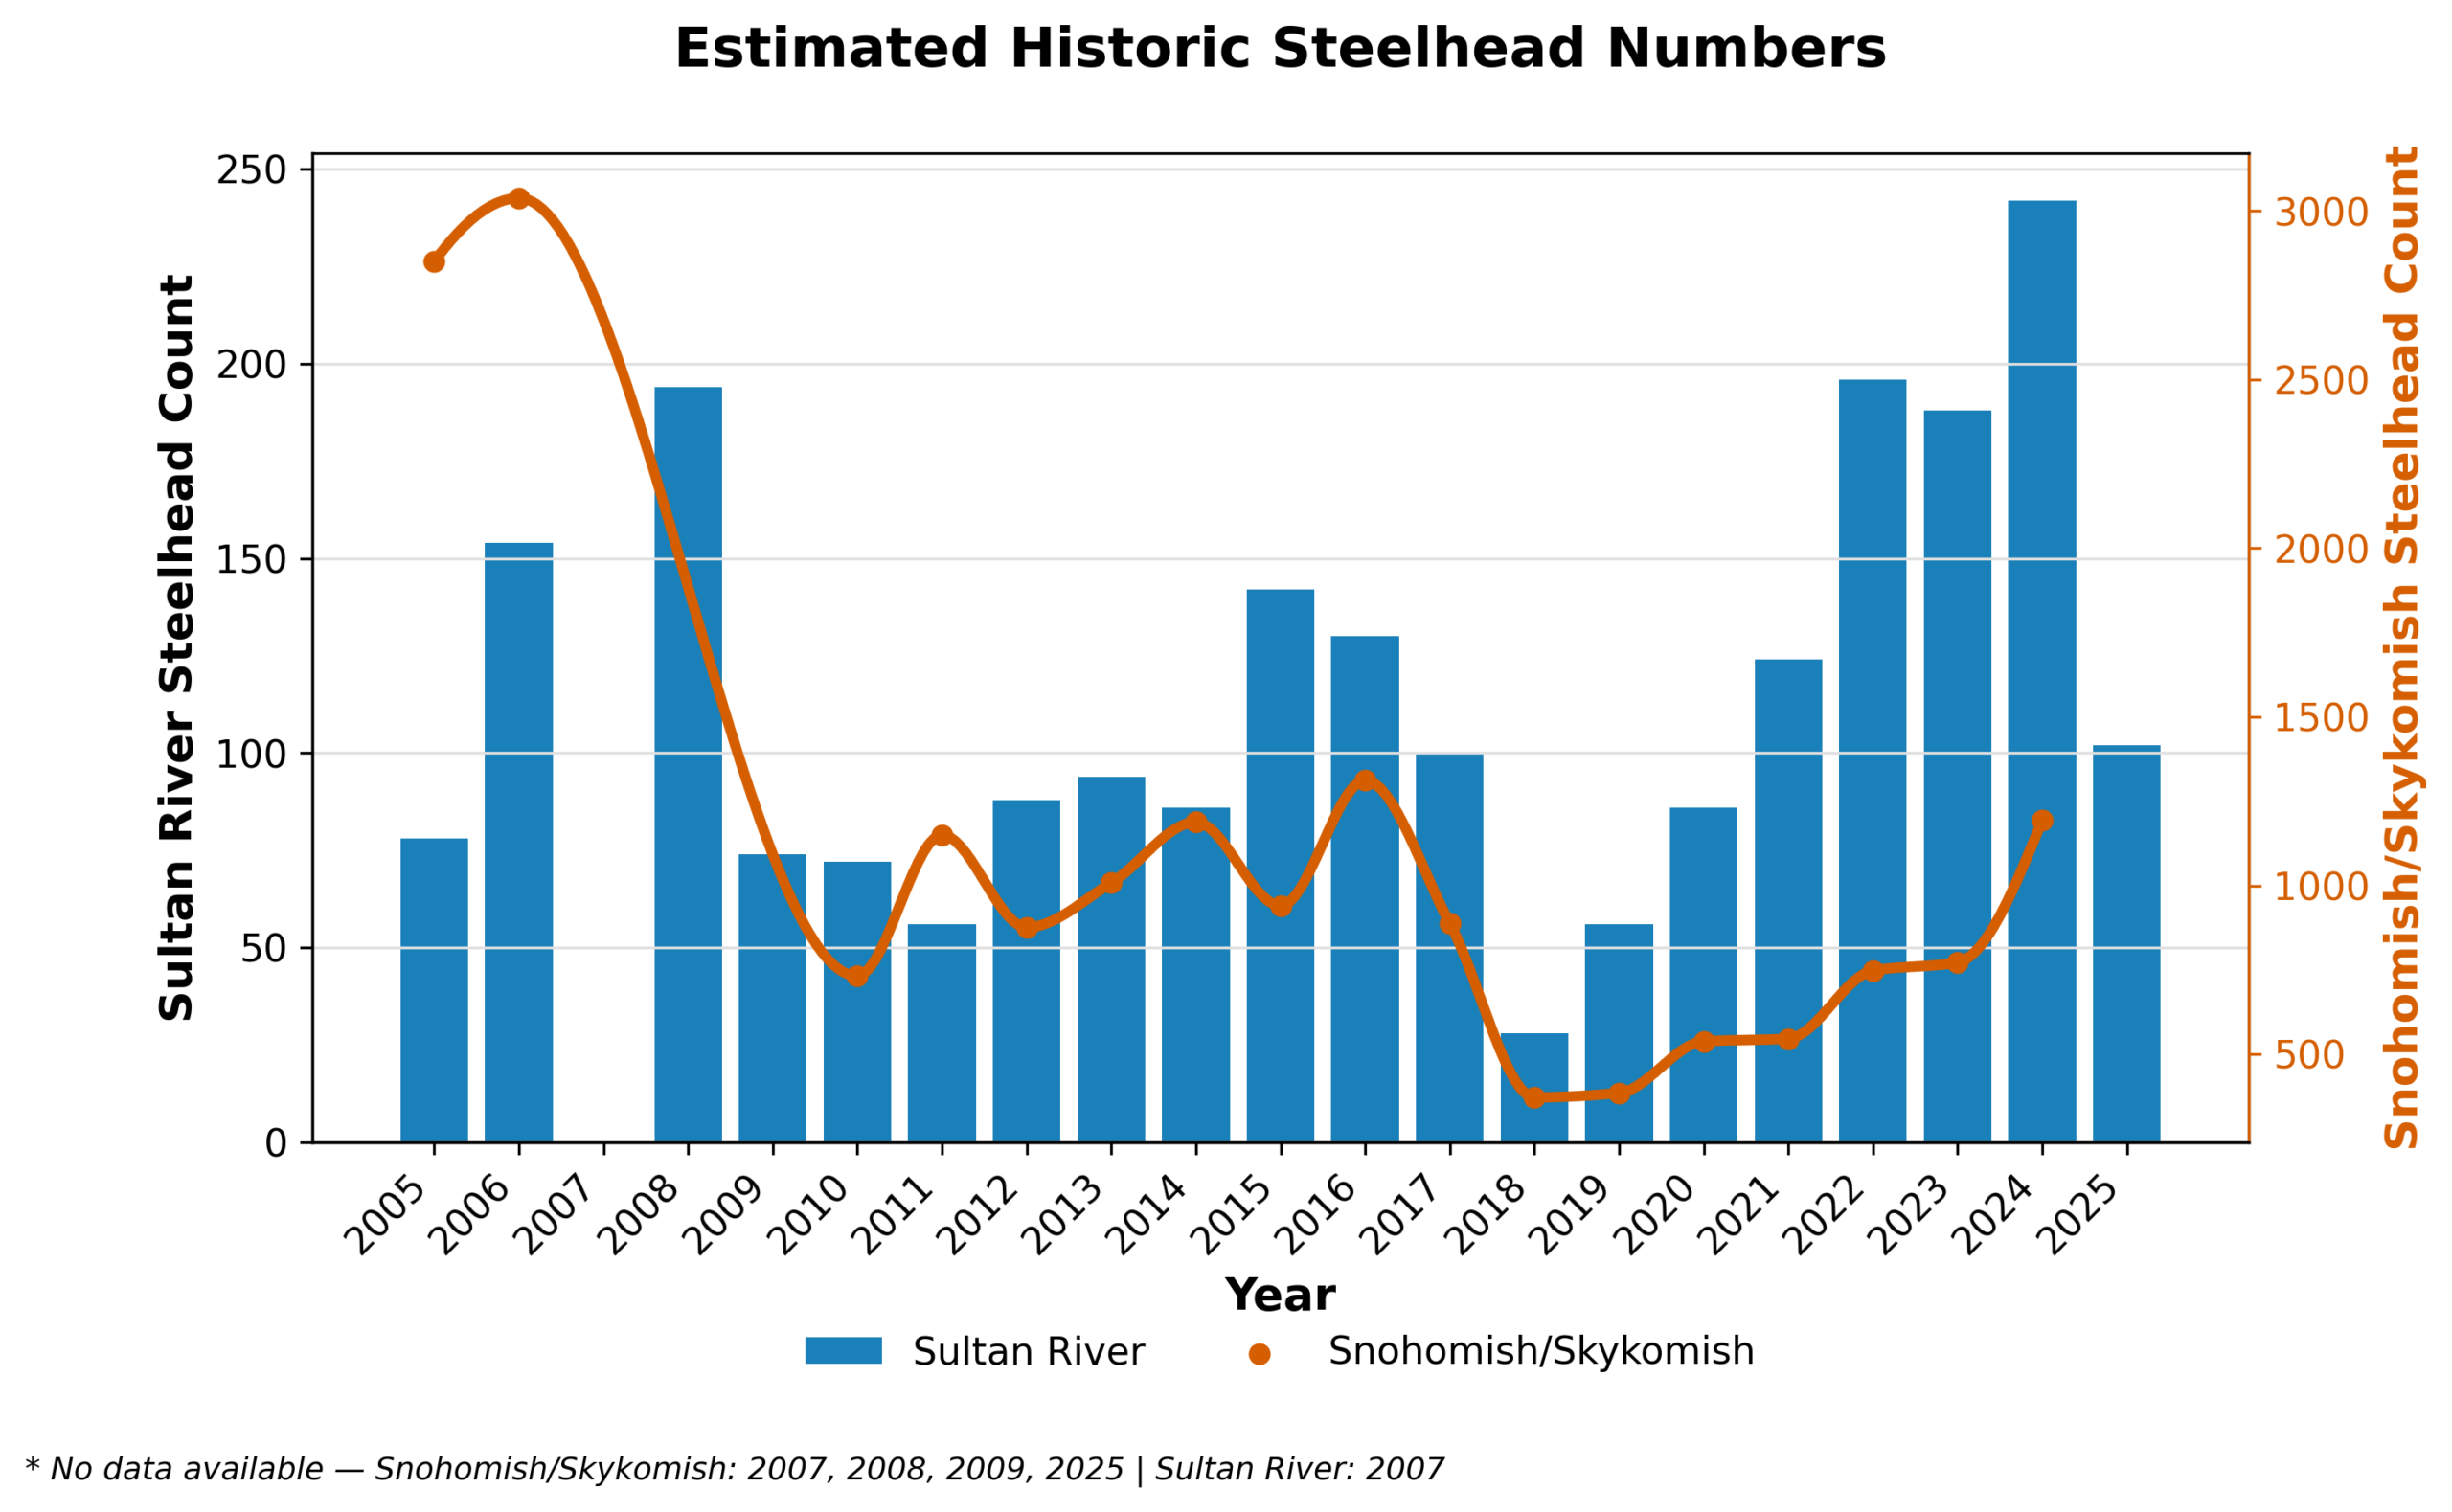
Estimated Chinook salmon and steelhead escapement in the Sultan River is shown below alongside basin-wide estimates for the Snohomish and Skykomish rivers to provide regional context. While year-to-year variability reflects factors such as ocean conditions, streamflow, and habitat availability, these comparisons help inform long-term management and evaluation of salmon populations associated with the Jackson Hydroelectric Project.
Note: Some years include incomplete data due to monitoring limitations or unavailable regional estimates.
Juvenile salmonid monitoring (smolt trapping)
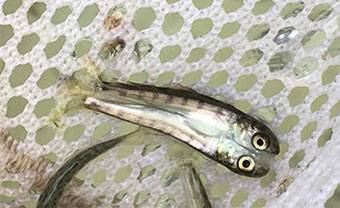
Another way the PUD monitors salmonid populations is by using a smolt trap. A smolt is a young salmon (or trout) that has undergone physiological changes and migrates to the sea for the first time.
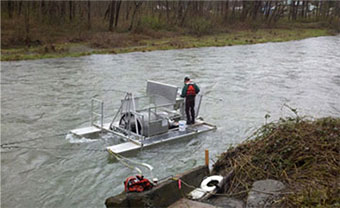
Since 2012, PUD biologists have operated a smolt trap in the lower Sultan River, approximately 0.2 miles upstream of the confluence with the Skykomish River in the City of Sultan. The trap is operated during the out-migration period from January through June.
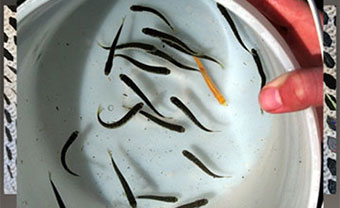
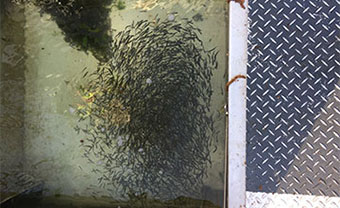
In 2025, the PUD began operating the smolt trap on January 23. The smolt trap faces upstream, and the cone at the front of the trap rotates as water passes through. A portion of the juvenile salmon out-migrating from the Sultan River enters the cone and is funneled toward the back of the trap. Fish are held in a live box where PUD biologists sort, count, and release them each day the trap operates.
The smolt trap results are compiled in the Excel spreadsheet below. There are 2 tabs in the spreadsheet: Current Year and Historical Data.
CURRENT YEAR TAB:
- The table and chart will be updated bi-weekly from February through June 2025, with out-migration information from the Sultan River smolt trap. The table and chart show the number of salmon caught per hour each week the trap operates. This measure is calculated by dividing the total number of a fish species caught in one week by the total number of hours the trap fished in that week. This method accounts for the fact that the trap is fished for different amounts of time each week – generally anywhere from 20-80 hours per week. Weekly fish catch totals alone can be misleading because less fish are likely to be caught in weeks that the trap has fished for less hours – regardless of how many fish actually migrated out of the river. The fish per hour measure displayed here corrects for this and provides a more accurate way to compare weekly data within a season and between years. The table also shows the total number of different fish species caught each week, as well as the number of hours the trap fished per week.
HISTORICAL DATA TAB:
- Figure 1 allows viewers to compare the current trend in out-migration, which shows the average out-migration timing of each salmon species since monitoring began in 2012.
- Table and Figure 2 summarize and display by year the catch per hour of Chinook, chum, and pink salmon.
- Table and figure 3 show the total number of juvenile Chinook, chum, and pink salmon that out-migrated from the Sultan River by year, calculated from mark and recapture studies.
Last Updated 5/16/25